Wednesday 1 August 2012

Business Intelligence - Comparisons and Rating Methods

We frequently have the challenge of measuring and comparing different reports, metrics, KPIs, Data Sources against one another. Either to highlight their importance, relevant, issues, risks or criticality etc. One approach we have been using is an adaption of the UK Government threat level scale.

The concept is very simple, we have 5 classifications that can be used to demonstrate the status of the items you are comparing. Security agencies use the following:

  • Low - an attack is unlikely
  • Moderate - an attack is possible, but not likely
  • Substantial - an attack is a strong possibility
  • Severe - an attack is highly likely
  • Critical - an attack is expected imminently

Extract from, https://www.mi5.gov.uk/output/what-are-threat-levels.html

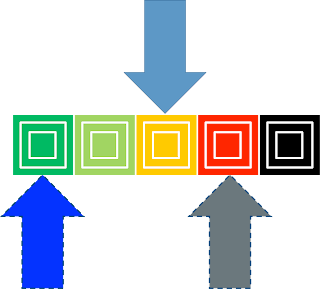
If we focus on the Threat levels we have a very simple, pictorial scale. We like this view because of the speed at which it allows comparison and the flexibility of the meaning:


This graphical view maps neatly to the descriptions used for defence, so for our BI needs:
  • CRITICAL - Imminent risk or issue (black)
  • SEVERE - Highly likely
  • SUBSTANTIAL - Strong possibility
  • MODERATE - Possible but not likely
  • LOW - Unlikely (green)
In terms of the basis / relative measure then this can be adapted to the needs / comparison being made. Our suggestions are to make these SMART measures or as smart as possible and use as much detail as necessary - there is a fine balance between maximising meaning whilst keeping this simple. One that we have used recently is for the likelihood of data quality. For example: 
"The likelihood of the data having a quality issue which would have an impact on the report production process and cause an SLA to be missed in 6 months". 
Depending on the circumstances the different categories can be seperated by % likelihood:
  • CRITICAL - Imminent risk (80 - 100%)
  • SEVERE - Highly likely (40 - 80%)
  • SUBSTANTIAL - Strong possibility (20 - 40%)
  • MODERATE - Possible but not likely (5% - 20%)
  • LOW -Unlikely(5% or below)
These scales can be adapted to the scenario. We have also had several comparisons on one view, i.e. the data quality example above with production risk and complexity (complexity uses number of sources rather than %).

Pointers

Once we have this defined for our classifications or indeed classifications if there is a report lifecycle review. The obvious pointer is for current state (colour schemes can be tweaked of course). The reason we like this approach is for its flexibility so we could have current state displayed above and also very easily show previous and desired state below. This is especially powerful when monitoring changes over time, essentially giving you a vector as to progress. We like to use this when showing the changes over time on a road map so that customers can see the benefits of the change over time.


We would be delighted to hear your views or examples of how you would compare BI components,

5point9

Saturday 25 February 2012

Email is Dead?

Monday 23 January 2012

#5.9Life

Our 5point9 foundation is information and the effective use of that information. We want to bring users closer to their information. We are launching the Twitter hash tag #5.9Life for people to share the cool use of information no matter where it comes from.

#5.9Life


The aim of this is to create a community or forum for like minded individuals to share examples of information - good or bad, over any medium and for any use. We will see how it develops but we hope it is embraced as intended, a fun way to share examples of information.


Hope to see your Tweets soon,


5.9

Saturday 21 January 2012

Big Data - The foundations and building blocks

There have been many predictions for 2012 and one common theme is that Business Intelligence and Analytics will continue to be a big area of growth for CIO's. This resonates strongly with the ethos at 5point9, where we want to help customers maximise the value from their information. Big Data is also being heralded again as a discipline or area inside this. In this post we take a look at Big Data and the likely developments / issues.


In this post we take a look at Big Data and focus on the building blocks or foundations of the platform and considerations, this is a topic we are going to be looking at in more detail over the common weeks.


Doing it because you could rather than because you should
Big issue with Big Data. This is something that is common place and this is usually indicative of the disconnect between the business and the technical team. There are many moving parts inside Business Intelligence / Analytics programs and this is intensified in the big data concept. The result of this is that you have a solution which is fantastic but is disconnected from the business.


There are many techniques to counter this but one way which we have used with success with many customers is to have a Steering Group which is based on teams from the various parts of the organisation who come together as equals with senior buy in. This is not a guarantee of success and this must be time boxed and have a strong chair. The teams involved should be made up of the technical elements (Data Owners, Master Data Management, Infrastructure etc) and from the business there should be representatives of the line of business and users. The key benefit of this is that everyone is aligned from the beginning and there is broad agreement of the vison for the project - what it will achieve, why it is happening, the expected ROI and justifications.


Visualisation techniques:
Despite this being a hot topic for several years this is still an area of neglect. A lot of effort is put into the data and this is absolutely essentially. However without a platform for business users to simply and effectively interact with data the solution will become a white elephant. 


There needs to be an interface which allows users of all levels of capability to use and gain insights. The consensus that senior managers need a high level and information workers need to be able to access the details is too restrictive. Dashboards are not the answer for the execs and low level detail is not always the answer for the information workers. Everyone in the organisation is a consumer of the information and therefore should be able to traverse through several layers of detail and complexity simply and still understanding the context. There needs to be a story to set the scene and make it simple for users to understand what is being looked at. The old mentality of assuming that senior people are not tech savvy or only want to see a high level is flawed. 


At 5point9 we want to enable all users (with the right security) to be able to understand the 35,000 ft view but also get in amongst the reeds of their business. The social network angle is still woefully in adequate in organisations but this is beginning to grow with the use of collaboration tools and the integration of these with the data and information. Large organisations are now embracing instant messaging but are stil lagging behind on the social developments - we are developing a post on this soon, watch this space.


Actionable information:
We have a rule at 5point9 with customers for Big Data and BI - if we cannot succinctly describe the actions which will result from something we do not include it. This can be a heated activity but one which customers delight in. Once this ethos is distilled we can see real change within the customer and a much improved focus. We want to be a sniper rather than shooting from the hip.


One outcome of this approach is that there is absolute business clarity from the data right the way through to the knowledge used by the business. It can often highlight areas of missing information or additional details that are required for data to become actionable.


Security and Audit: 
Do you have a handle on who can see what data and how is this being managed? Is the decision maker / team deciding this correctly placed? Has the business being consultated and what is the process for users to change what they can see? This is a big area and one which can easily frustrate users. 


There is a balance between restricting users to the correct level and also allowing them enough access to see the information they need to do their job effectively. This is also massively influenced by regulations and industry specific standards. As well as security access the audit-ability of what users have seen needs to be considered and as big data is more prevalent this becomes key to be able to report on this.


Data Governance:
Master Data and Data evolves over time as does security and users requirements (visualisation etc). We need to ensure that vehicles are put in place to handle this. Big Data programs which do not iterate or allow for change will quickly become dormant and redundant.


Performance:
If the performance is slow or the tool is cumbersome or the users have issues, they will create silos or extractions from the repository. You users are resourceful and smart - which is why you have hired them. Is this happens you quickly revert to having pots of information without governance and control or consistency. You lose the ability to ensure that data is being used across the organisation consistently. The simple way to do this is to ensure the performance of the system and ensure that users have the correct level of access in time and accurate.


Data availability must also be processed within acceptable time limits. We helped a large retail outlet who had expanded at unprecedented rates. There data could not be processed within the windows available to them because of the logistics of the manufacturing and retail teams covering the globes. These challenges need to be addressed and highlight the need for the steering group to be involved early and have a broad coverage of the moving parts.


What do you think?


Thanks for reading,


John

Wednesday 30 November 2011

Every Newspaper ... Ever


An amazing project has just gone live in the UK - Four million pages of newspapers from the 18th and 19th Centuries have been made available online by the British Library.
Most of the newspapers printed from 1800 can now be searched and accessed online. Whether for nostalgia or for research into the past this is a fantastic feat to bring dormant, hard to access information into the modern information age. 
The public can now scan the content of 200 titles from around Britain and Ireland. Local events and individual knowledge will be a tremendous resource but also with the power of hindsight, you can look at events unfolding at the time and how the events unfolded.
It would be interesting to see how the search ability and visualisations will be completed by the team. Having looked at this with our Information Access / Search experts it is difficult to traverse articles and find the details of the stories. One idea that was liked was enabling user tagging, i.e. user can tag and add details to the stories to add colour and context to the seemingly smaller stories to the larger context of events and vice versa.
5point9

Thursday 20 October 2011

Give Me Signals from Noise - Information Filters


Is there too much information too handle? Does the volume of information available to us dilute our intake of quality?


The consequence of the information explosion is that it is increasingly difficult to know what to look at. What book to read, which movie to see, which blog to follow, who to watch on twitter... Time is a diminishing asset as more and more sources compete for our attention.

Because of this at 5point9 we believe that the mediums which allow us to filter which information are increasingly critical. 

The Man Booker prize is proving to be the most popular yet. This is an example of this high value filtering which people are looking to increasingly with the information explosion. Going for over 40 years the award is ran each year and whittles down the contenders to a shortlist and is an old world example of filtering. There is of course other trusted sources of information that we use, both new and old world: trusted blogs, industry leaders, Top of the Pops (?). We believe that with the increased competition for our time brands (competitions) like the Man Booker will be increasingly popular. 

In the context of the work place we have the same issue. Most large organisations have several portals or disparate silos of information - where should you turn first? There is a need for some analysis, whether automated or manual to give the user the detail they need. Clever algorithms and behavioural analysis can do a huge amount as well as other sinews of automated intelligence. As we saw with Google when they started to look at human intervention it opens up a lot of questions in terms of who should control information and what are the consequences?

Thanks,

5point9


Tuesday 27 September 2011

Game Changing...

Some of the team have been divulging in some RnR with the third instalment of the Gears series. We keenly look to game theory and innovation in our information management and business intelligence projects and we were very impressed by Foldit's recent achievements which harnessed gamers.


Foldit, launched in 2008 by the University of Washington aims to harness the might of the video gaming community to do good in the world and the results are pretty staggering and compelling. The premise was to see if a critical mass of gamers would be able to find the answers or solve puzzles for science as the tag line reads.


The popularity of Foldit has been increasing and recently, in a matter of 10 days, gamers were able to do what biochemists have been trying to do for 10 years - unlock the structure of protein called retroviral protease. This is an enzyme that is key to understanding the way HIV multiples. It is hoped that this will help scientists understand and then prevent the way this grows. You can see how we are doing here on our profile page.

You can find out more here and their blog is well worth a view. Other initiatives look to harness the power of the human brain to out perform the performance of super computer, Galaxy Zoo is an other example.


At 5point9 we tend to use the techniques that work in game theory to improve business solutions. This can often include rewards, ambient find-ability and maintaining interest levels through levels of details. To find out more get in touch with us at Technical@5point9.com.


Sunday 11 September 2011

Green Clouds

Further to our previous post (http://tinyurl.com/5point9Cloud) on Cloud Computing and calculating the Return On Investment (ROI) there is a new study which shows the green impact that cloud can have and further benefits of going to cloud.


The report which has been created by the CDP (Carbon Disclosure Project) estimates that through cloud computing, there is the potential to reduce global carbon emissions by millions of tons. The report is well worth a read and goes on to show the projected savings that are to be made through cloud computing. 


The research is compelling and reinforces the benefits of cloud computing in a rarely considered angle of the energy consumption and associated cost savings as well as the holistic benefits. As we have mentioned when considering moving to the cloud it is critical to consider these factors when looking at the NPV and ROI calculations. 


For more information you can reach us here: info@5point9.com.

Technorati Tags: Cloud, Go To Market, Pricing, Business Model, 5point9

Friday 2 September 2011

ROI Calculations - It doesn't have to be rocket science

Supporting our clients to build business cases and return on investment calculations is something which we are regularly engaged in. One common misconception is that this extremely complex and something akin to rocket science. It doesn't need to be.


When we engage to assit clients to define their business cases our first question is: Why are you doing this now? This may sound easy but it is often something which our customers can not always succinctly define. There is often a lot of pontification and perceived benefits or pressures from areas of the business but no measurable criteria or monetary value saving. We also try and come at these challenges from the savings perspective. Why: If it is not going to offer you savings, what benefits are you going to get? Even if the driver is legislation or regulations their is still a monetary benefit as you will be reducing the risk of litigation or a fine. 


So how do you begin to work out the savings? We recommend taking a look at the FTE's who will be involved and their average costs - we then work this out at a very broad level to give a day rate or even more granular, such as a hourly rate or even minute rate. With this you are in a position where you can immediately work through some scenarios for the savings you will make and build in some assumptions. This does not take into account the benefit of financial implications of freeing up the resources to do more high value or other key tasks which will impact your business in a positive way or if IT is involved any technology savings.


The next thing that we do is to look at the primary, secondary and tertiary drivers. These are the things that will impact the business case to varying degreed:


  • Primary
    • These are the elements which will directly drive the benefits of the project. 
    • If the project is optimisation related, this could be the amount of an asset used and the amount to be saved by this project. This can then be mapped to a cost per GB for CAPEX and OPEX (maintenance, management etc.).
  • Secondary
    • This can vary largely on a case by case basis. In general terms we consider this to be areas that will be impacted but will not have the same effect as the primary driver. They are effected but not to the same extent as the primary, we use Pareto's law here, 20% should be primary and where we focus.
    • To follow the optimisation use case, this could be the benefits of reassigning the asset to something else and the cost savings or value of doing that. This can be complicated and may not be required.
  • Tertiary
    • These tend to be things that are in proximity but not directly involved.
    • We consider these to be things of interest but not having significant impact. They are included to have a holistic view.


We have developed various ROI calculations for various Line Of Business (LOB) activities and we can share further details on these. You can reach us at info@5point9.com.


Thanks,


For further information or details you can reach us here Enterprise@5point9.com


Technorati Tags: Business Case, Compelling, 5point9

Friday 19 August 2011

Simplicity is complex resolved, Constantin Brancusi

We are often called in to assist clients with their business intelligence solutions and the one common challenge that we find is to simplify the information so that the user can effectively action the information. We have come up with a simple and sometimes controversial approach – we don't always give users what they want.


Business Intelligence solutions are growing in importance and the need to have effective access to information and maximising the benefits of the insights are now business imperatives. Whether to meet compliance / regulatory demands in financial services, advanced analytics in anti fraud cases or performing forecast scenarios the need to enable users to simply converse with data is critical.

It is always tempting to try and offer the user a feature rich experience in order to maximise the amount of data available in a dashboard or report. Offering users the maximum from what they have is always a solid approach however it is often by saying "no" to features or data that can be more useful to users and the business. The risk and common pitfall that we see is that there is a risk of "noise" which can dilute the information and insights that are available for the user. This noise can be in the form of irrelevant or spurious data, extra features which users rarely use of complex filtering or other secondary and tertiary  features which can slow reports or make it very complex. We are not suggesting that we want to limit the ability to drill or interact with the data but that these features are done in a logically and intelligent way which makes sense.

It is always positive to get the users input into dashboards, dials or reports but the issue is that the user does not always know what they want – this may sound counter intuitive or a brave assertion but the number of dials and pie charts that we see allow us to conclude that things have been done because they could rather than what they should. User feedback is important for adoption but in order to avoid the above pitfalls their should be a business decision maker who has the right to veto and is the single point of decision making.

The approach that we use is to create prototypes on paper which can then be reviewed in workshops with the various decision makers and users. This is a powerful tool and can be drawn on with marker pens to show how they can be improved. After a couple of iterations there is usually consensus and the single decision maker has come to the conclusion of what should and should not be included. Once this has been completed the initial version of reports and tools can be created and shared with the business. With web analytics, this should then be monitored to see how the users are interacting with the tools and also who effective the reports are being, we always try and tie back the reports to actionable insights and therefore business results – this helps to focus the offerings and can highlight areas of improvement or additional information requirements. This continuous improvement cycle will have a longer timeframe and require less effort once the business intelligence solution is in place as the solution is honed and streamlined to the business.

 Thanks,

You can reach us at Technical@5point9.com

Technorati Tags: Business Intelligence, Data Visulaisation, 5point9